Author
Ashar Mirza - VoicePing Inc.The Problem
We run a translation microservice using FastAPI and vLLM. Under heavy load, we hit server latency issues that didn’t match what our GPU utilization metrics suggested. GPU utilization showed a stuttering pattern: spike to 93%, drop to 0%, spike again. Not the consistent high utilization we expected. The question: if the GPU has idle periods, where’s the bottleneck? This article covers how we identified the architectural issues in our FastAPI + multiprocessing setup that were preventing efficient GPU utilization.System Context
Our translation service runs as multiple API servers behind a load balancer:
Figure 1: Overall system architecture showing client applications, proxy/load balancer, and multiple API servers
- Clients: Web, mobile, backend services
- Proxy: Routes requests based on language pairs and server health
- API Servers: Multiple FastAPI instances, each running vLLM
API Server Architecture
Here’s the internal structure of one API server:
Figure 2: Single API server architecture showing FastAPI, multiprocessing queues, worker processes, and vLLM instances
Components
1. FastAPI Main Process
- Handles HTTP requests with async/await
- Single Python process, one event loop
- Non-blocking I/O for concurrent request handling
2. TranslationService
- Creates translation tasks
- Manages EventTask objects with asyncio.Event
- Bridges async/await with multiprocessing
3. TranslationWorker (Main Process)
- Queues created in main process (shared with workers)
- JoinableQueue for task distribution
- manager().dict() for shared task state
- Event queue for results
4. Worker Processes
- Spawned as separate processes (ctx.Process)
- Each loads its own vLLM model instance
- Pull from shared translation_queue
- Return via shared event_queue
5. EventTask (Async Synchronization)
- Bridges multiprocessing with async/await
- Each request gets an EventTask
await event.wait()blocks coroutine until worker completes
Request Flow
Here’s what happens for a single translation request:
Figure 3: Step-by-step request flow showing serialization points and async waiting
- Client POST /translate → FastAPI creates async coroutine
- async translate() → TranslationService handles request
- create_task() → Generate ID, create TranslationTask in shared dict
- queue.put(key) → Serialize task key, send to workers (IPC overhead)
- Worker: vllm.translate() → Worker processes translation
- event_queue.put(result) → Serialize result, send back (IPC overhead)
- event.set() → Update EventTask, wake coroutine
- await event.wait() unblocked → Retrieve result
- Return response → Send to client
- Step 4: Serialization (pickle task key)
- Step 6: Serialization (pickle result)
- Step 8: Async waiting for multiprocessing result
- IPC coordination throughout
Baseline Performance
Before optimization attempts: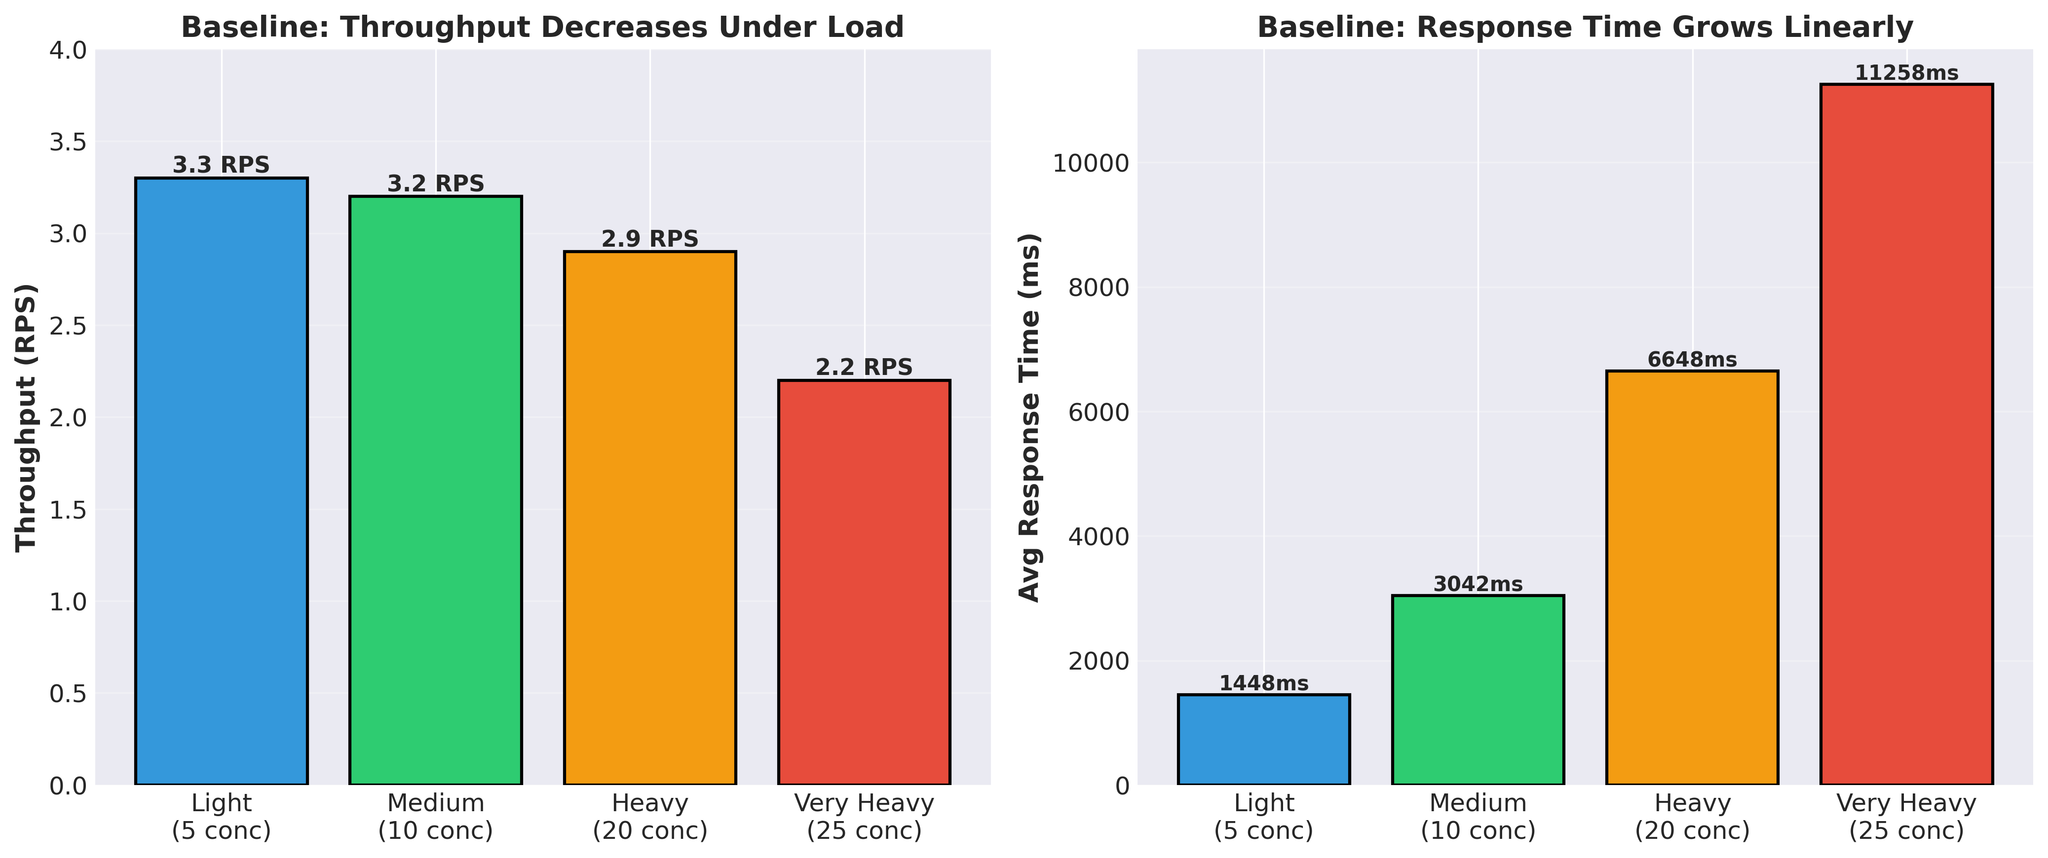
Figure 4: Baseline performance showing throughput decrease and response time increase under load
- Response time grows linearly (1.4s → 11.3s)
- Throughput decreases under load (3.3 → 2.2 RPS)
- Actual vLLM translation time per request: 300-450ms
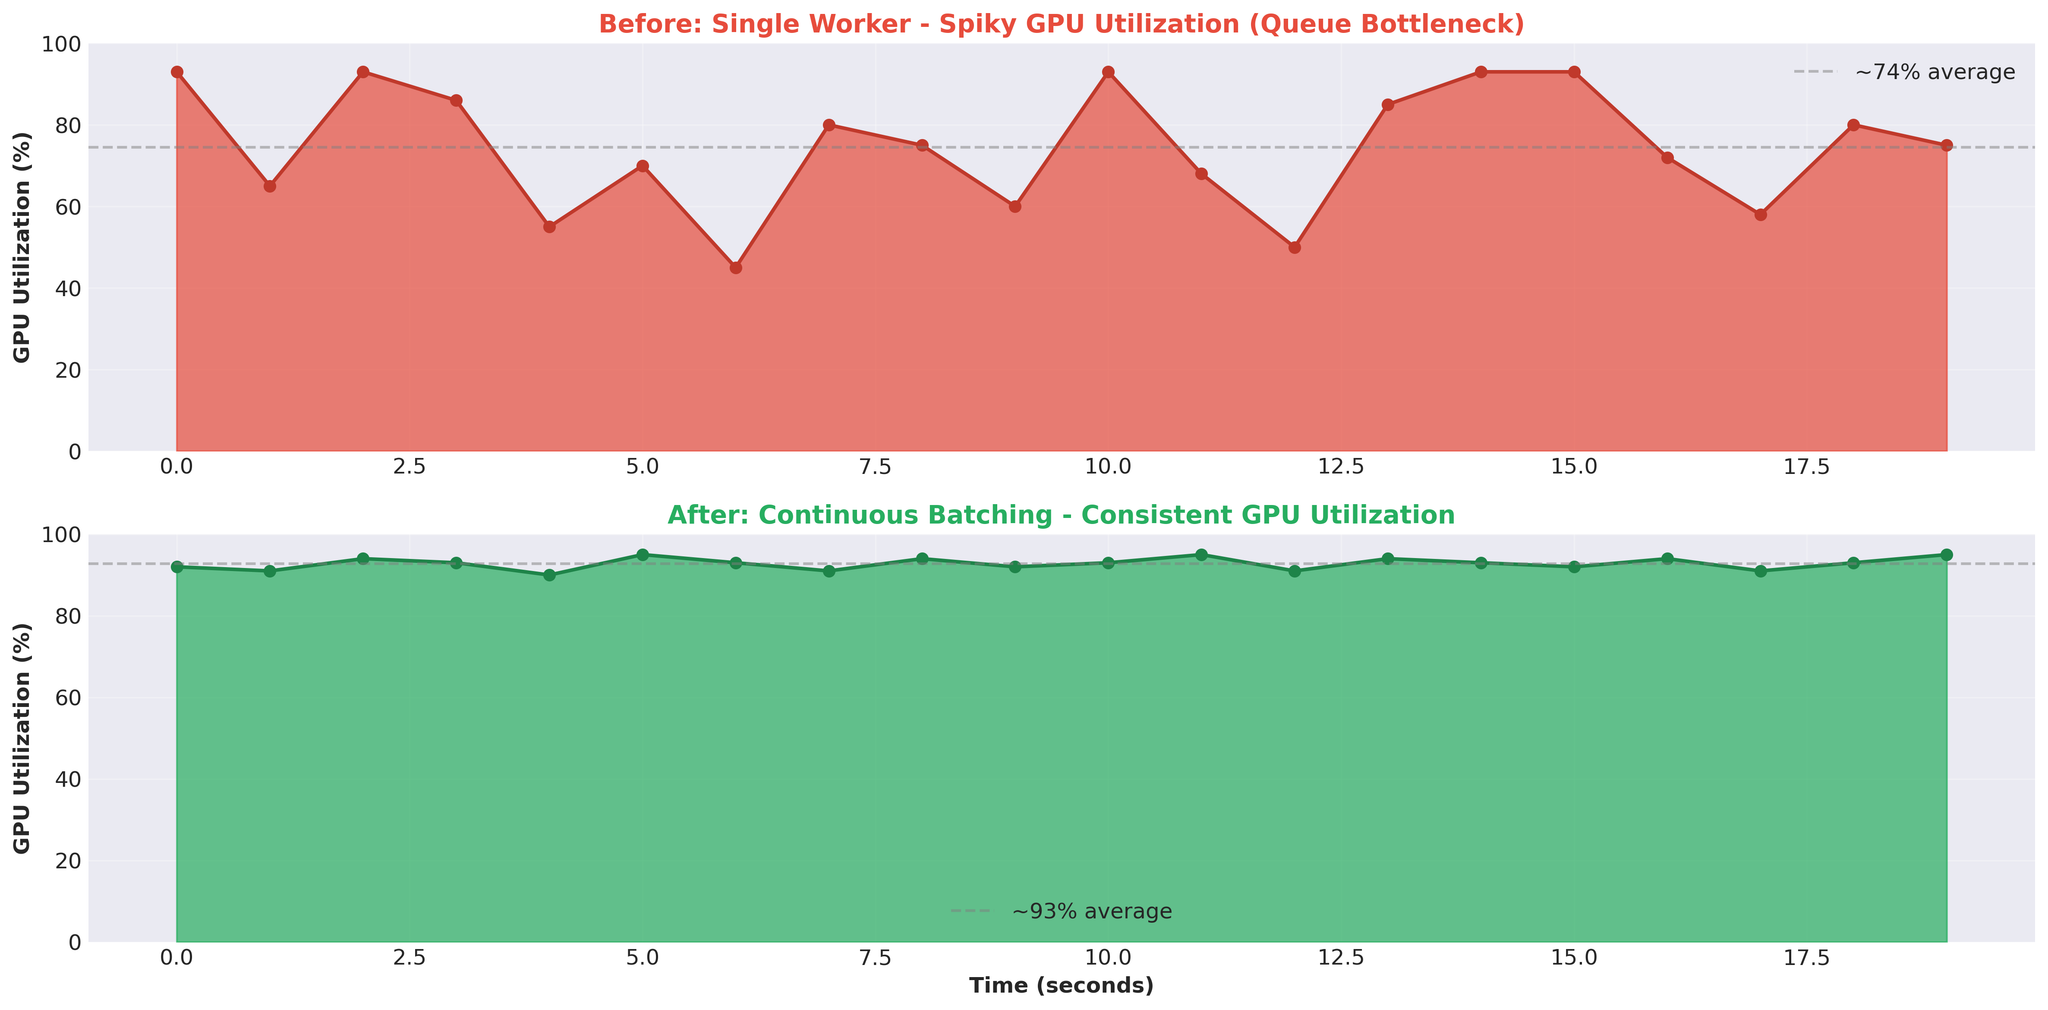
Figure 5: GPU utilization pattern before (spiky) and after (consistent) optimization
Attempt 1: Multiple Workers
First hypothesis: more workers = better parallelization. We increased from 1 worker to 2 workers.Configuration
- Worker 1: Models A+B
- Worker 2: Model C
- Both share the same GPU
Results
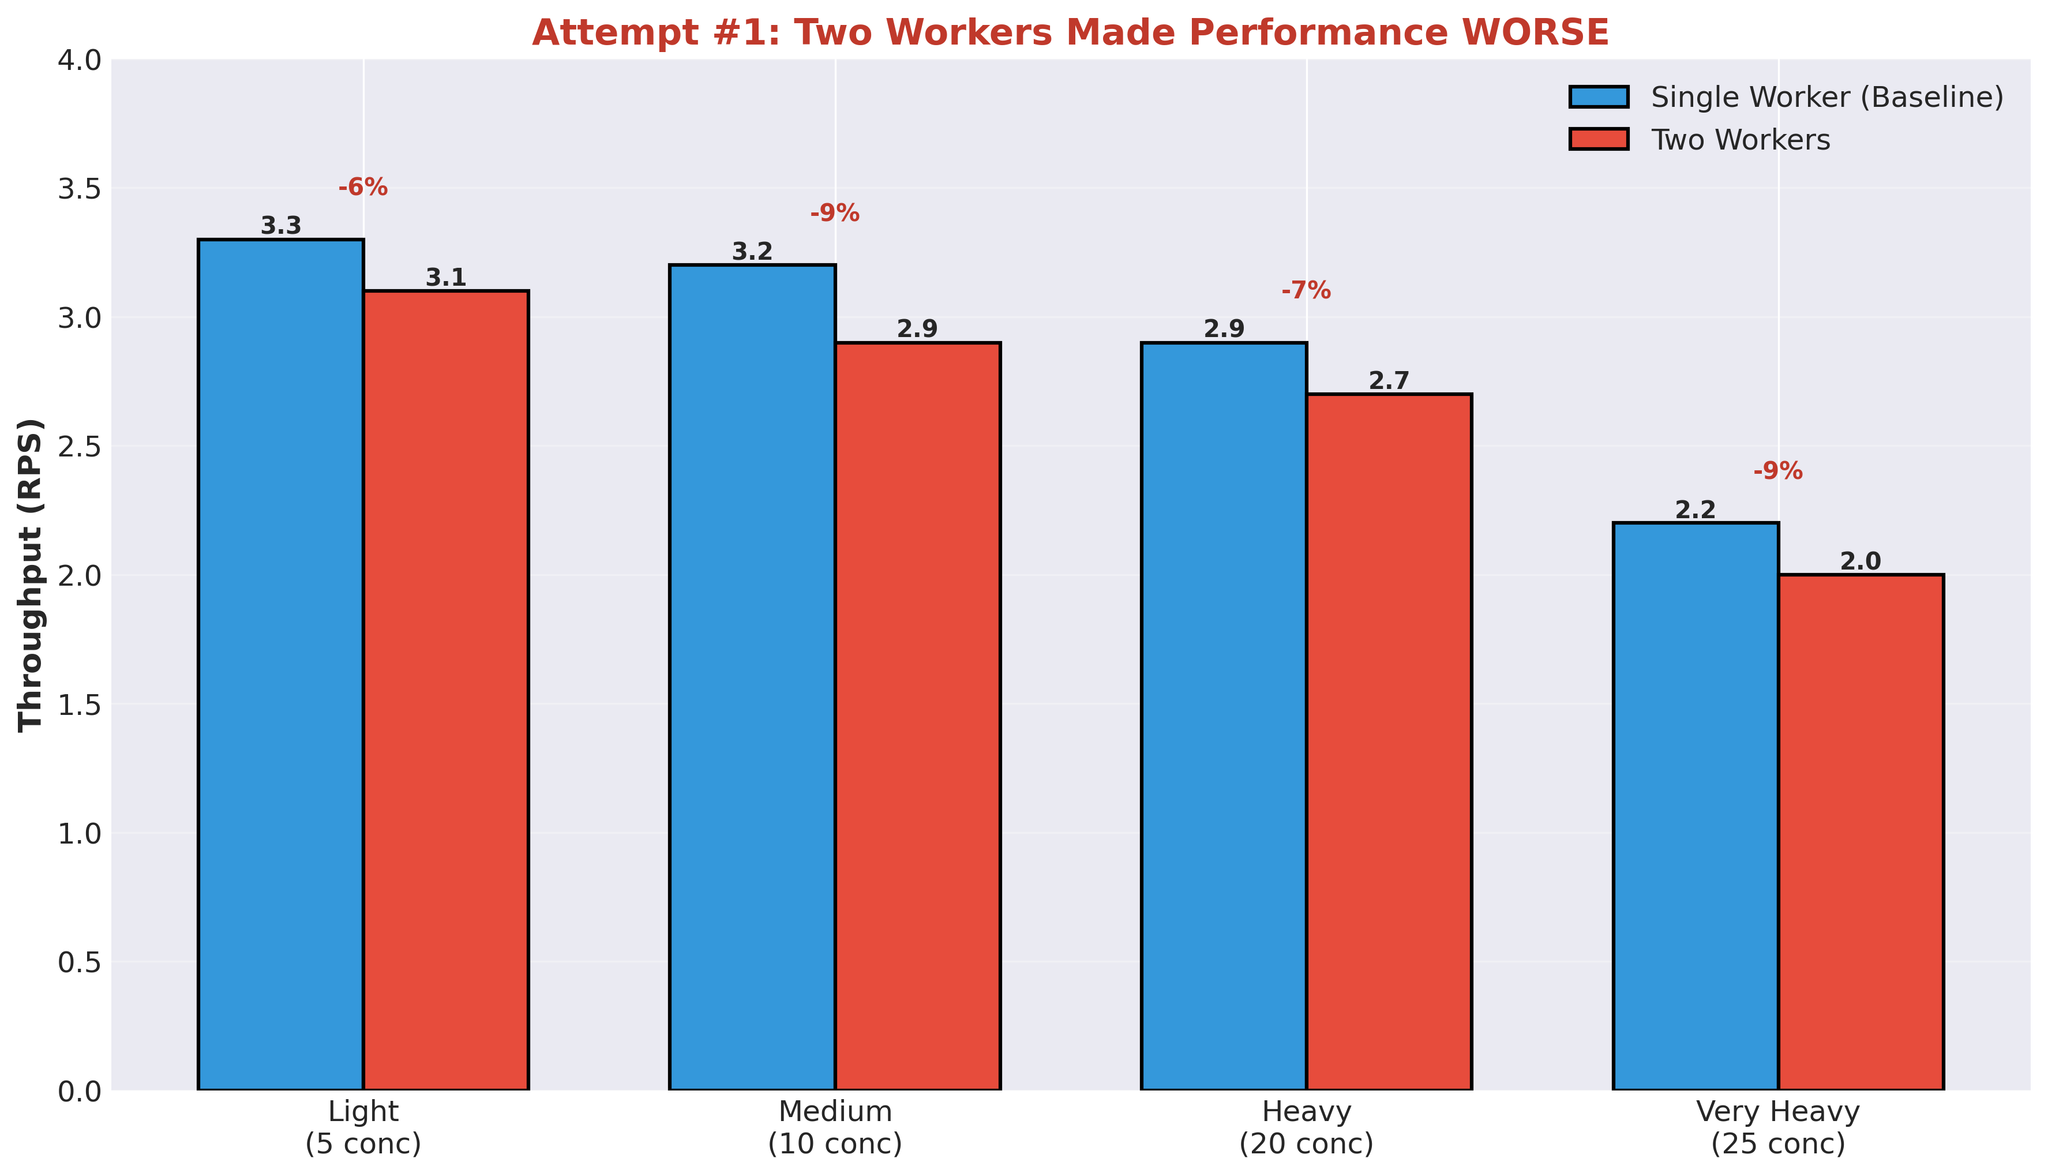
Figure 6: Performance degradation when adding a second worker process
Why Multiple Workers Failed
This result makes sense when you understand GPU behavior and our architecture.
Figure 7: Multiple worker processes competing for GPU compute capacity
The Issue: Compute Contention
When one worker is processing a translation:- It uses ~90% of GPU compute capacity
- Other workers can’t effectively utilize the remaining capacity in parallel
- Workers end up waiting for GPU availability
- Worker 1 starts vLLM generation → uses ~90% GPU compute
- Worker 2 tries to start → only ~10% GPU compute available
- Worker 2 runs slowly or waits
- Effectively sequential execution despite separate processes
- Process spawning and management
- GPU memory split between workers (each loads model weights)
- IPC queue coordination
- Context switching between processes
Additional Architectural Issues
With multiple workers competing for the same resources:- Context switching overhead: OS switching between worker processes
- Doubled memory usage: Each worker loads full model weights
- No effective parallelism: Sequential GPU execution despite parallel architecture
Identified Bottlenecks
After this experiment, we identified the core issues:1. IPC Serialization Overhead
- Every request: serialize task → worker, serialize result → main
- Python multiprocessing queue uses pickle
- Overhead on every request
2. Compute Contention
- One worker using ~90% GPU compute
- Other workers can’t run effectively in parallel
- Sequential execution despite multiprocessing
3. Async/Await + Multiprocessing Bridge
- asyncio.Event waiting for multiprocessing result
- Thread-based event queue consumer
- Coordination overhead between async and multiprocess models
4. Wasted GPU Cycles
- GPU idle while waiting for queue operations
- Spiky utilization (93% → 0% → 93%)
- Translation time ~400ms, total response time 11+ seconds
- Most time spent in queues, not computing
5. Architecture Complexity
- FastAPI (async/await)
- TranslationService (bridge)
- TranslationWorker (coordination)
- JoinableQueue (IPC)
- Worker processes (multiprocessing)
- Event queue (IPC)
- EventTask (async sync)
- vLLM (actual work)
Key Insights
1. Async/Await + Multiprocessing = Overhead
Bridging these two concurrency models requires coordination:- asyncio.Event for async waiting
- Thread pool for consuming event queue
- Serialization at process boundaries
2. Multiple Processes ≠ GPU Parallelism
Adding worker processes doesn’t automatically improve GPU utilization when:- One worker uses ~90% of GPU compute
- Insufficient remaining capacity for parallel work
- Sequential execution despite multiprocessing overhead
3. Queue Overhead Dominates
At 25 concurrent requests:- vLLM translation time: ~400ms
- Total response time: 11,258ms
- Queue overhead: ~97% of total time
4. Spiky GPU = Architectural Issue
- Consistent GPU utilization (e.g. 90-95%) indicates compute-bound workload
- Spiky pattern (93% → 0% → 93%) indicates the GPU is waiting for work—bottleneck is elsewhere (in our case, queues and IPC)
Conclusion
The bottleneck wasn’t GPU capacity. It was our multiprocessing architecture: Issues identified:- IPC overhead from queue serialization
- GPU compute contention without effective parallelism
- Async/await + multiprocessing coordination overhead
- Most latency from queues, not vLLM processing
- Spiky GPU utilization
- Response time dominated by queue wait
- Adding workers made performance worse
In Part 2, we’ll cover the solution: eliminating multiprocessing, using vLLM’s AsyncLLMEngine directly, and achieving an 82% throughput improvement in production.
- Remove multiprocessing architecture entirely
- Use vLLM’s AsyncLLMEngine with FastAPI directly
- Right-size continuous batching configuration
- Production result: Improved throughput (+82%)