Overview
The Business Intelligence (Beta) feature leverages AI to extract actionable insights from meeting logs. By analyzing transcripts, the system automatically generates mind maps and data structures, allowing you to visually understand sales pipeline status and product development needs.Step 1: Create a New Project
To begin your analysis, first create a project.- Navigate to the Business Intelligence (Beta) tab in the top navigation bar
- Click the blue + Create New Project button on the right side of the screen
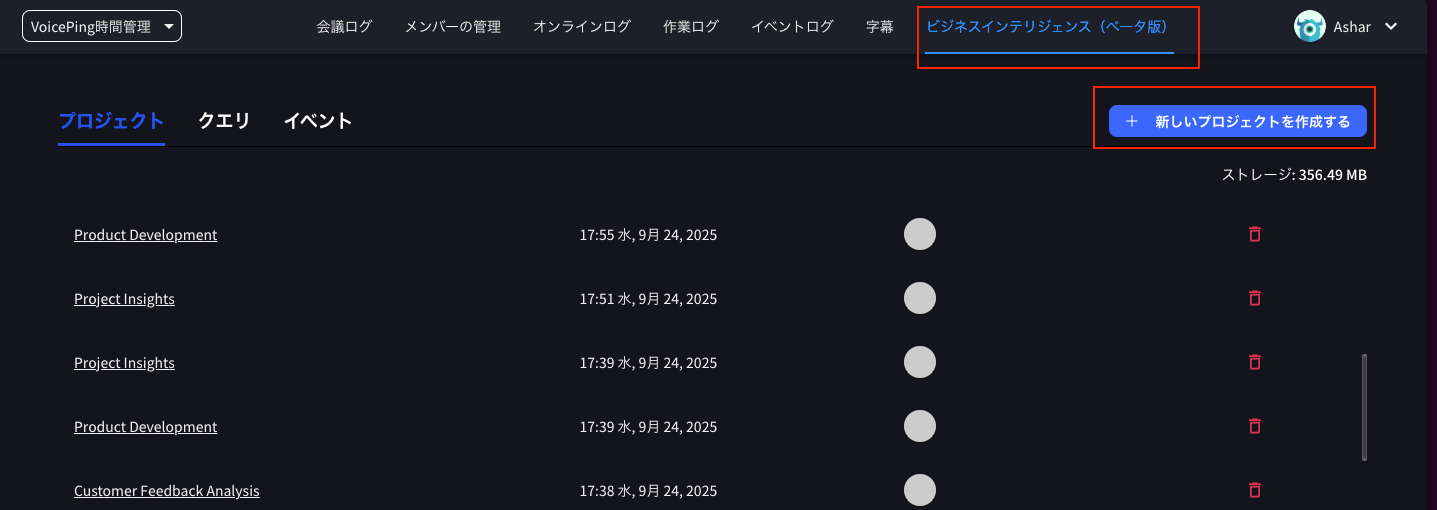
- A modal window titled “Create New Project” will appear
- Project Name: Enter any name (e.g., “Sales Analysis”)
- Project Description: (Optional) Enter a description of your analysis
- Information Source for Project: Confirm that “VoicePing Meetings” is selected
- Click Create Project

Step 2: Select a Project Template
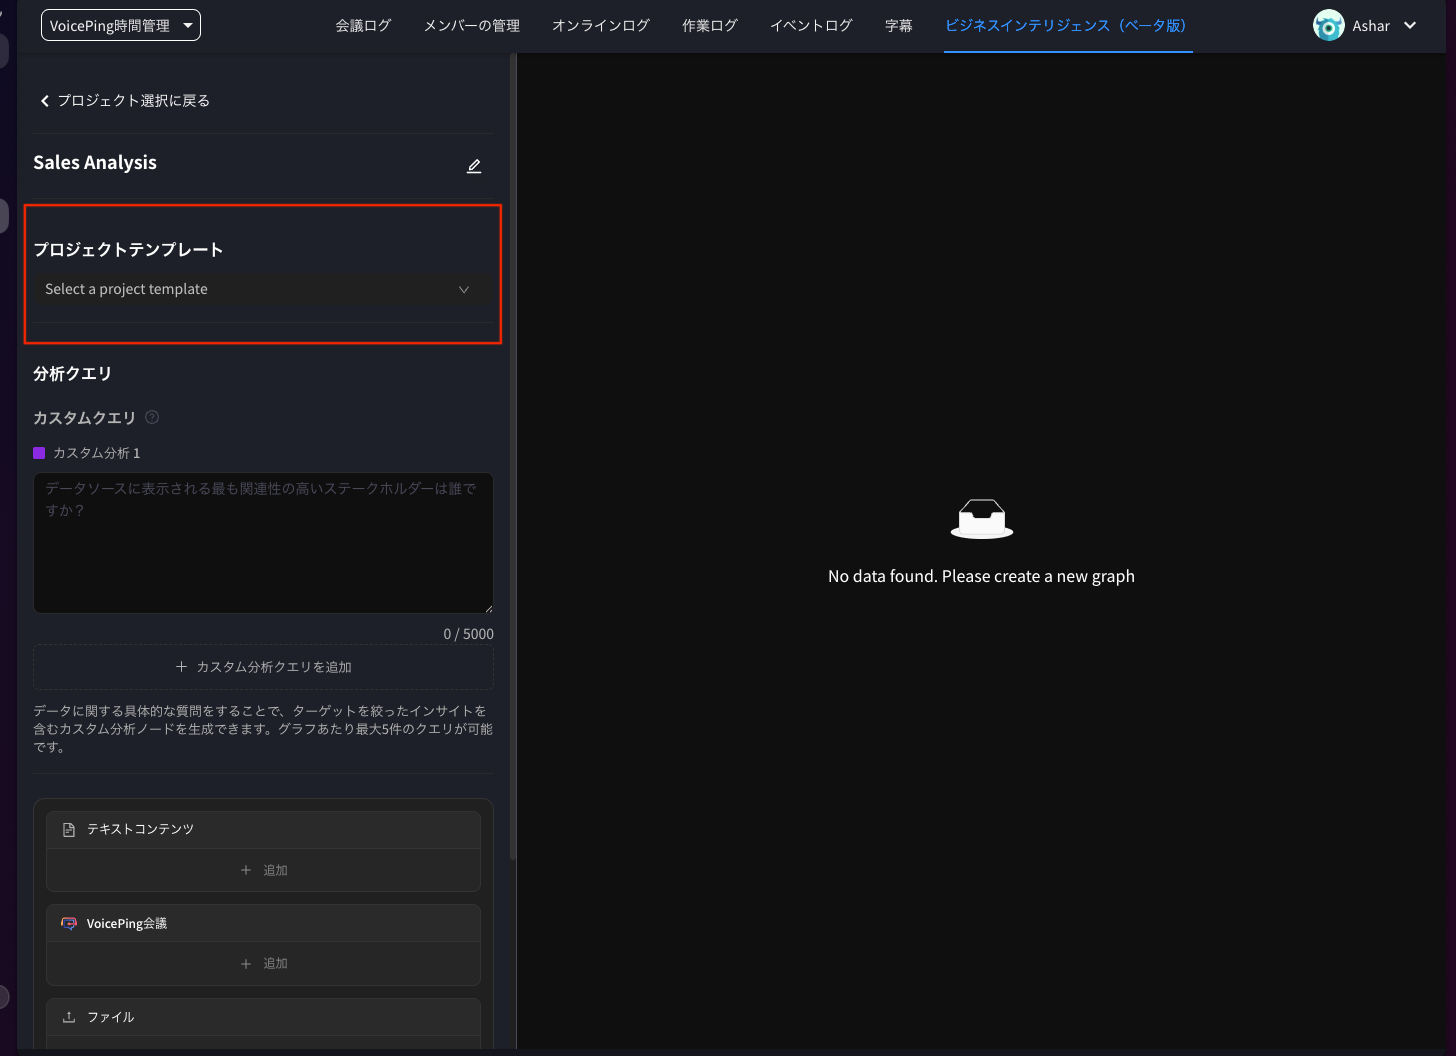
Once your project is created, choose a template that defines how the AI will analyze your data.- The project screen (e.g., Sales Analysis) will be displayed
- Click the Project Template dropdown menu
-
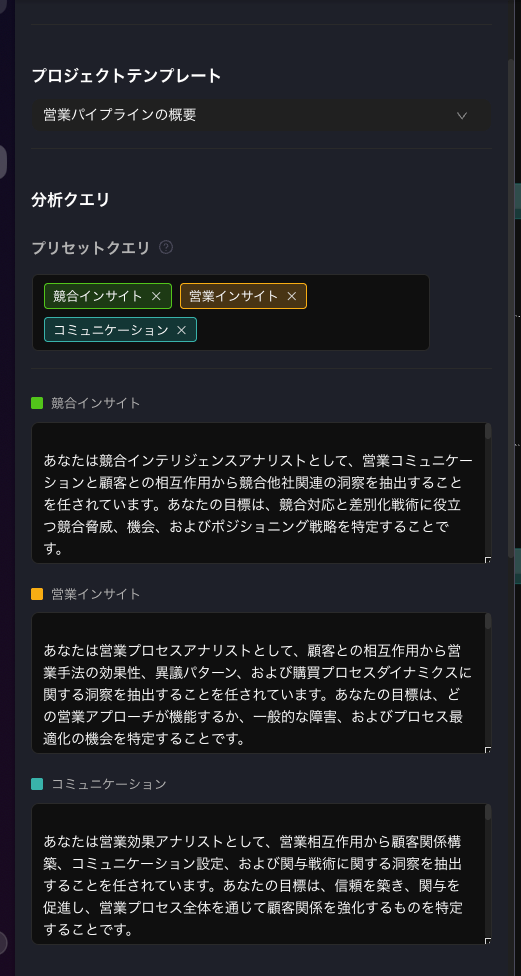
Select a template that matches your needs. Options include:
- Sales Pipeline Overview
- Product Development
- Project Insights
- Customer Feedback Analysis
-
When you select a template (e.g., Sales Pipeline Overview), Preset Queries will automatically appear in the Analysis Queries section
- These include items like “Competitive Insights,” “Sales Insights,” and “Communication” which guide the AI’s analysis
Step 3: Add Data Sources
Next, connect the specific meetings (transcripts) you want to analyze.- Locate the VoicePing Meetings section at the bottom of the project page
- Click the + Add button in the box
- The “Add Data Source” screen will appear
- Check the boxes next to the meetings you want to analyze (e.g., “Discussion on potential product adaptation and NDA” or “JP customer interview…”)
- Click the blue Add Data Source button at the bottom right

Step 4: Create Graph
Once you’ve selected a template and added data sources, run the AI analysis.- Confirm that Analysis Queries and VoicePing Meetings are configured
- Click the blue Create Graph button at the bottom of the screen
Step 5: Review and Export Insights
The AI will process your data and generate an interactive mind map.- Graph Interaction: Analysis results are displayed with “Customer Profile” at the center, branching into nodes like “Purchase Timeline Evaluation” and “Objection Pattern Identification”
- View Details: Click on nodes to view detailed analysis content
- Export: Use the buttons at the top right to save your data
- Export as CSV: Export raw data in CSV format
- Export as Image: Save the displayed graph as an image file

Updated 2025-12-12 by VoicePing Inc.