Author
Ashar Mirza - VoicePing Inc.Problem
ကျွန်ုပ်တို့သည် FastAPI နှင့် vLLM အသုံးပြု၍ translation microservice run လုပ်ပါသည်။ Heavy load အောက်တွင် GPU utilization metrics များ suggest လုပ်သည်နှင့် match မဖြစ်သော server latency issues ကို ရင်ဆိုင်ခဲ့ရပါသည်။ GPU utilization သည် stuttering pattern ပြသည်: 93% သို့ spike, 0% သို့ drop, ထပ်ပြီး spike။ ကျွန်ုပ်တို့ မျှော်လင့်ထားသော consistent high utilization မဟုတ်ပါ။ မေးခွန်း: GPU တွင် idle periods များ ရှိပါက bottleneck က ဘယ်မှာလဲ? ဤဆောင်းပါးသည် efficient GPU utilization ကို prevent လုပ်နေသော FastAPI + multiprocessing setup ရှိ architectural issues များကို identify လုပ်ပုံကို cover လုပ်ပါသည်။System Context
ကျွန်ုပ်တို့၏ translation service သည် load balancer နောက်ကွယ်တွင် multiple API servers အဖြစ် run ပါသည်:
Figure 1: Client applications, proxy/load balancer နှင့် multiple API servers ပြသော overall system architecture
Baseline Performance
Optimization attempts များ မလုပ်မီ: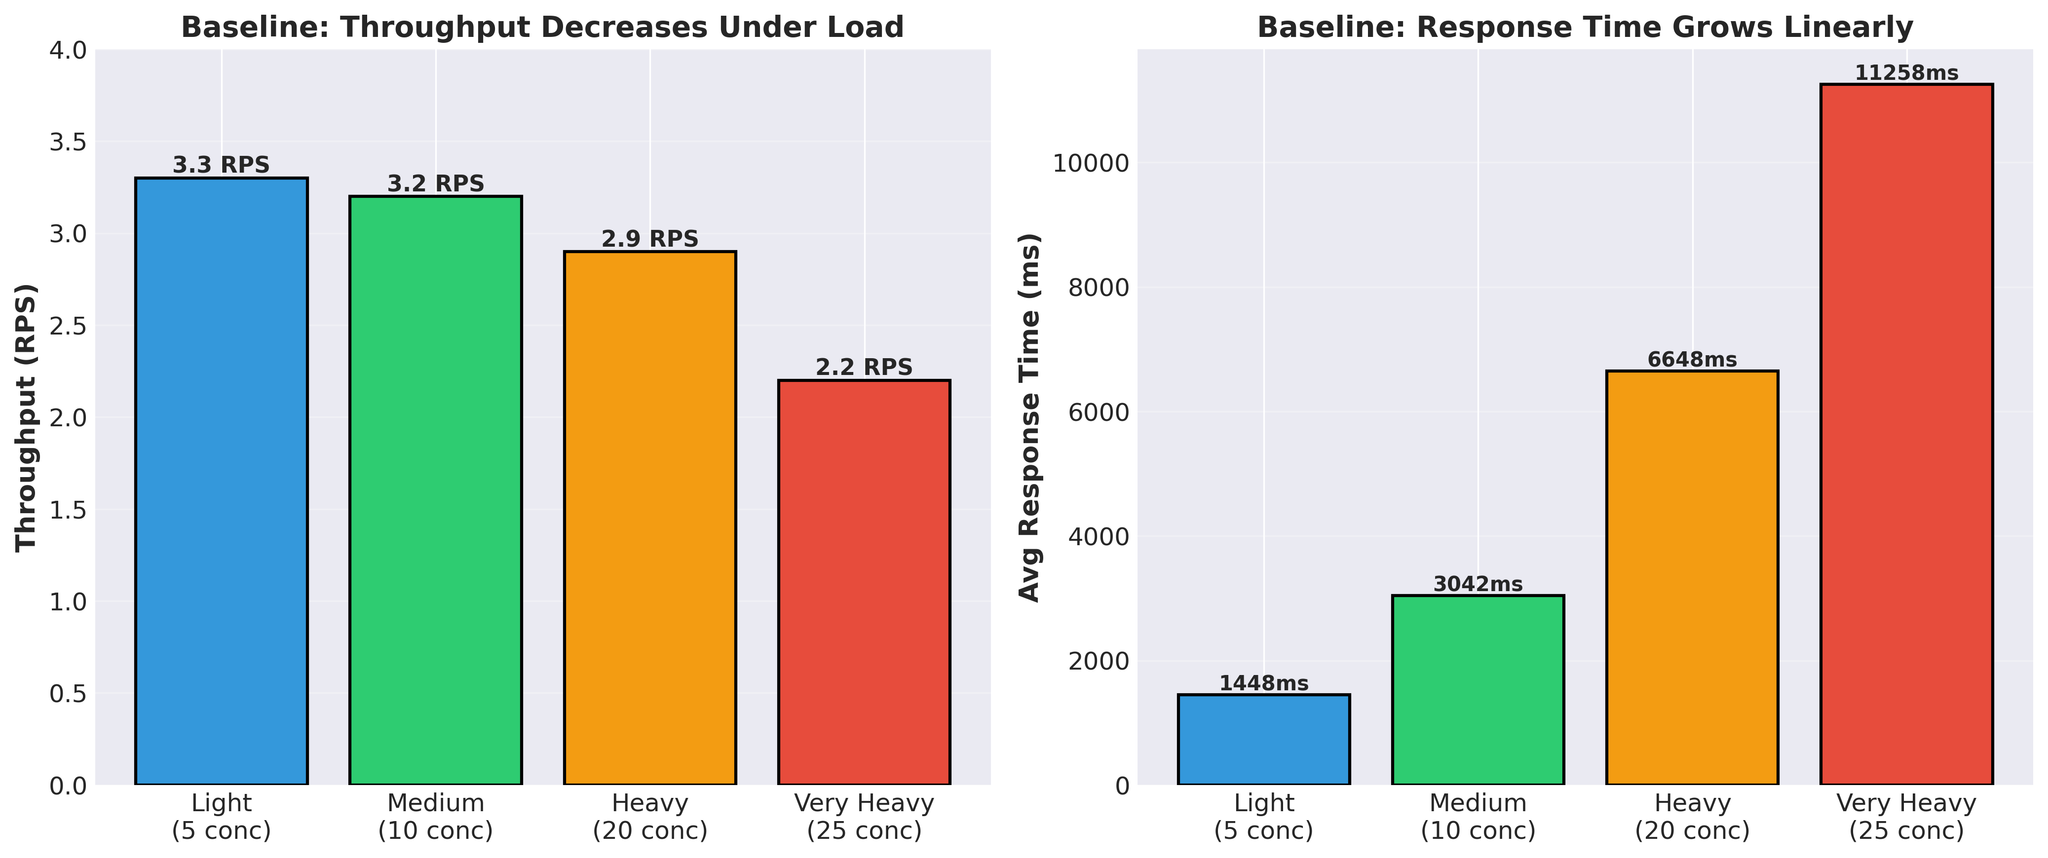
Figure 4: Load အောက်တွင် throughput decrease နှင့် response time increase ပြသော baseline performance
- Response time သည် linearly grow သည် (1.4s -> 11.3s)
- Throughput သည် load အောက်တွင် decrease သည် (3.3 -> 2.2 RPS)
- Request တစ်ခုလျှင် actual vLLM translation time: 300-450ms
Attempt 1: Multiple Workers
ပထမ hypothesis: workers ပိုများ = better parallelization။ 1 worker မှ 2 workers သို့ တိုးခဲ့ပါသည်။Results
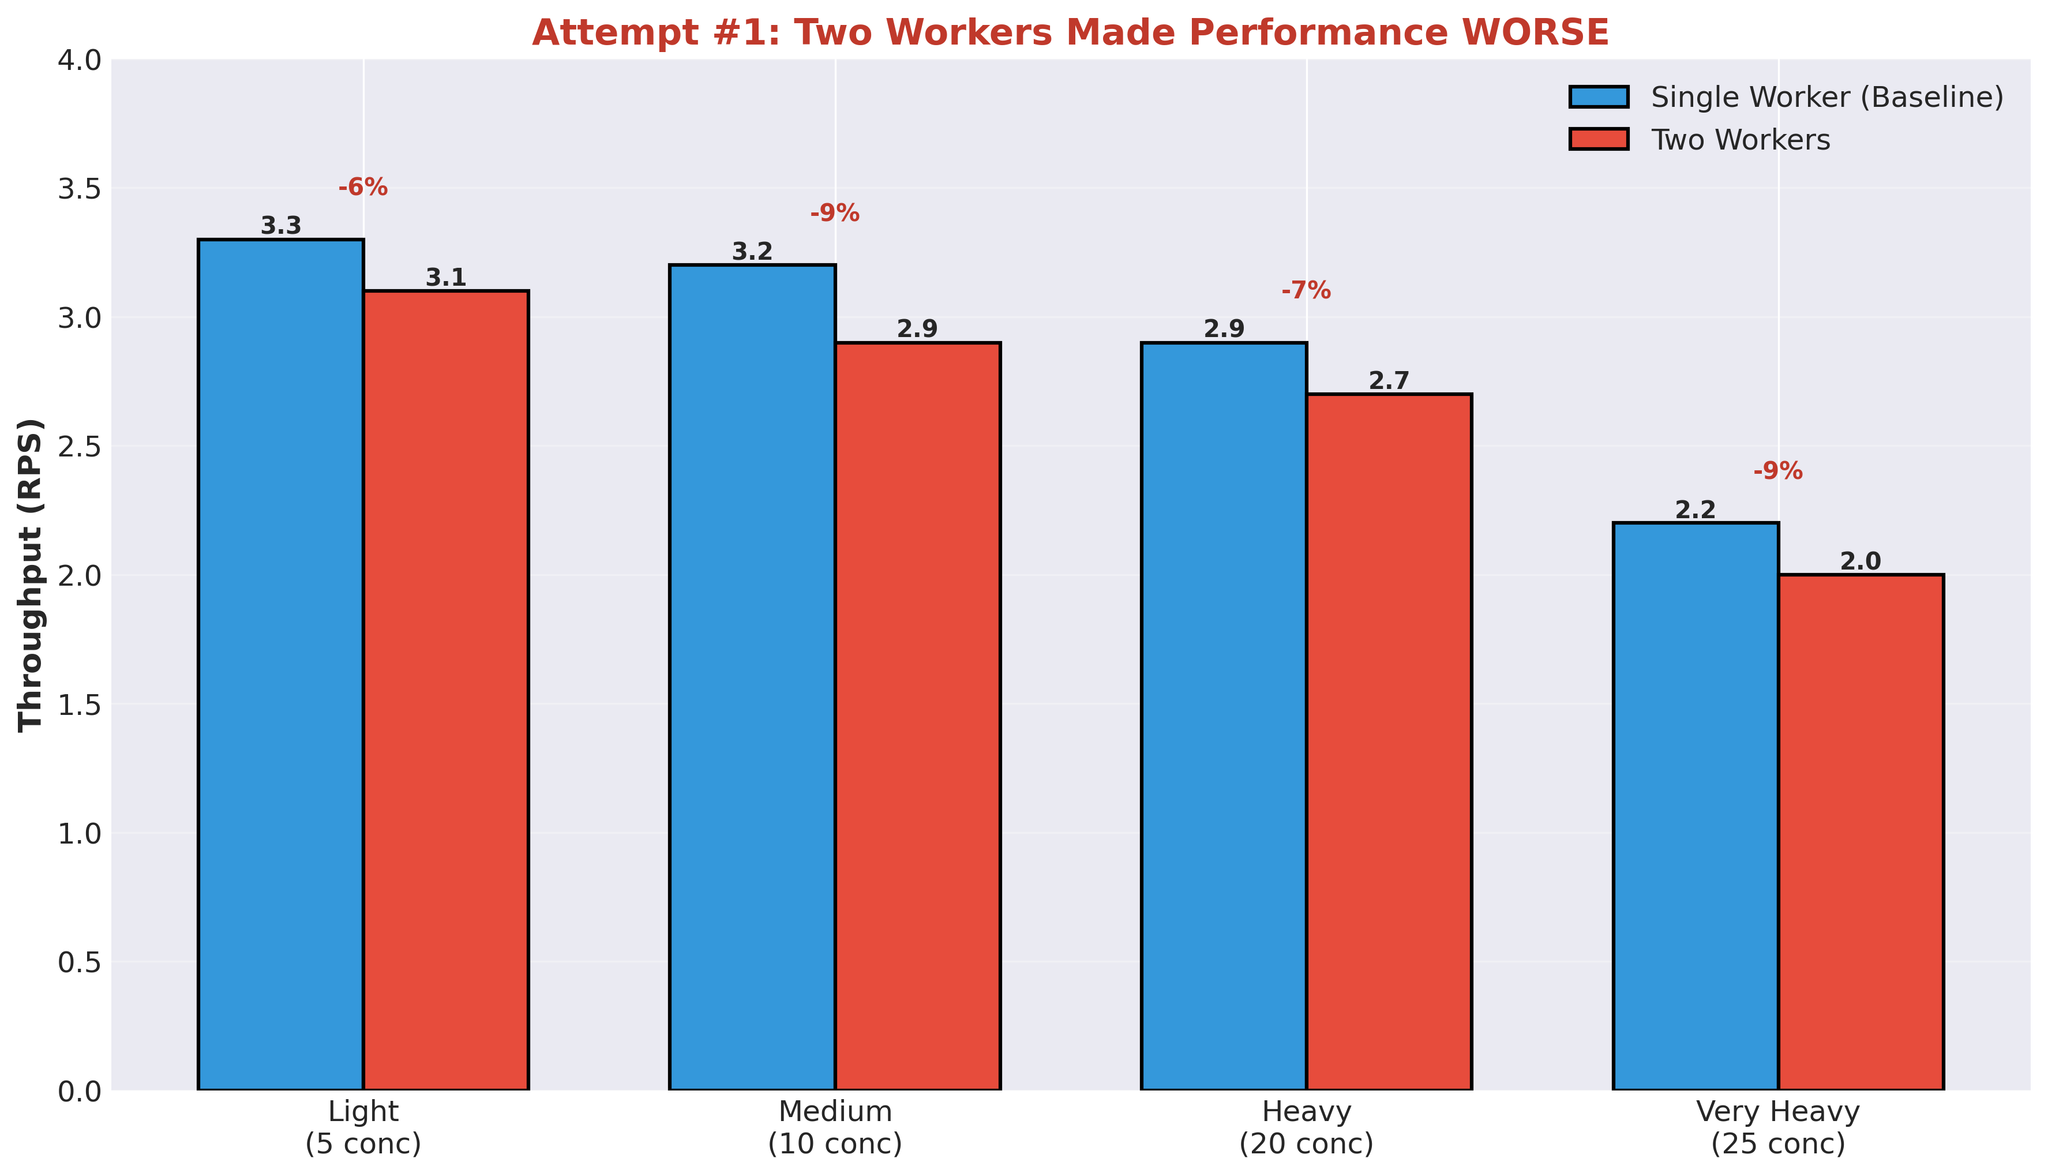
Figure 6: Second worker process add ခြင်းဖြင့် performance degradation
Multiple Workers ဘာကြောင့် Fail ဖြစ်ခဲ့သလဲ
ဤရလဒ်သည် GPU behavior နှင့် ကျွန်ုပ်တို့၏ architecture ကို နားလည်သောအခါ သဘောပေါက်ပါသည်။Issue: Compute Contention
Worker တစ်ခု translation process လုပ်နေသောအခါ:- GPU compute capacity ၏ ~90% အသုံးပြုသည်
- အခြား workers များသည် remaining capacity ကို parallel တွင် effectively utilize မလုပ်နိုင်
- Workers များသည် GPU availability စောင့်ရသည်
- Worker 1 သည် vLLM generation စတင် -> ~90% GPU compute အသုံးပြုသည်
- Worker 2 သည် start ရန် ကြိုးစား -> ~10% GPU compute သာ available
- Worker 2 သည် slowly run သို့မဟုတ် waits
- Separate processes ဖြစ်သော်လည်း effectively sequential execution
Identified Bottlenecks
ဤ experiment ပြီးနောက် core issues များကို identify လုပ်နိုင်ခဲ့ပါသည်:1. IPC Serialization Overhead
- Request တိုင်း: task serialize -> worker, result serialize -> main
- Python multiprocessing queue သည် pickle အသုံးပြုသည်
- Request တိုင်းတွင် overhead
2. Compute Contention
- Worker တစ်ခုက ~90% GPU compute အသုံးပြုသည်
- အခြား workers များသည် parallel တွင် effectively run မနိုင်
- Multiprocessing ဖြစ်သော်လည်း sequential execution
3. Wasted GPU Cycles
- Queue operations စောင့်နေစဉ် GPU idle
- Spiky utilization (93% -> 0% -> 93%)
- Translation time ~400ms, total response time 11+ seconds
- Time အများစုသည် computing တွင် မဟုတ်ဘဲ queues တွင် spend ဖြစ်သည်
Key Insights
1. Async/Await + Multiprocessing = Overhead
ဤ concurrency models နှစ်ခုကို bridging ရန် coordination လိုအပ်သည်:- async waiting အတွက် asyncio.Event
- event queue consume ရန် thread pool
- Process boundaries တွင် serialization
2. Multiple Processes != GPU Parallelism
Worker processes add ခြင်းသည် အောက်ပါအခြေအနေများတွင် GPU utilization ကို automatically improve မလုပ်ပါ:- Worker တစ်ခုက ~90% GPU compute အသုံးပြုသည်
- Parallel work အတွက် remaining capacity မလုံလောက်
- Multiprocessing overhead ဖြစ်သော်လည်း sequential execution
3. Queue Overhead Dominates
25 concurrent requests တွင်:- vLLM translation time: ~400ms
- Total response time: 11,258ms
- Queue overhead: total time ၏ ~97%
Conclusion
Bottleneck သည် GPU capacity မဟုတ်ပါ။ ၎င်းသည် ကျွန်ုပ်တို့၏ multiprocessing architecture ဖြစ်ပါသည်။Part 2 တွင် solution ကို cover လုပ်ပါမည်: multiprocessing eliminate ခြင်း, vLLM ၏ AsyncLLMEngine directly အသုံးပြုခြင်း, နှင့် production တွင် 82% throughput improvement ရရှိခြင်း။