အကျဉ်းချုပ်
Business Intelligence (Beta) feature သည် meeting logs များမှ actionable insights များ ထုတ်ယူရန် AI ကို အသုံးပြုပါသည်။ Transcripts များကို analyze လုပ်ခြင်းဖြင့် စနစ်သည် mind maps နှင့် data structures များ အလိုအလျောက် ထုတ်လုပ်ပြီး sales pipeline status နှင့် product development လိုအပ်ချက်များကို မြင်သာစွာ နားလည်နိုင်စေပါသည်။အဆင့် ၁: Project အသစ် ဖန်တီးခြင်း
Analysis စတင်ရန် ဦးစွာ project တစ်ခု ဖန်တီးပါ။- Top navigation bar ရှိ Business Intelligence (Beta) tab သို့ သွားပါ
- Screen ညာဘက်ရှိ အပြာရောင် + Create New Project button ကို နှိပ်ပါ
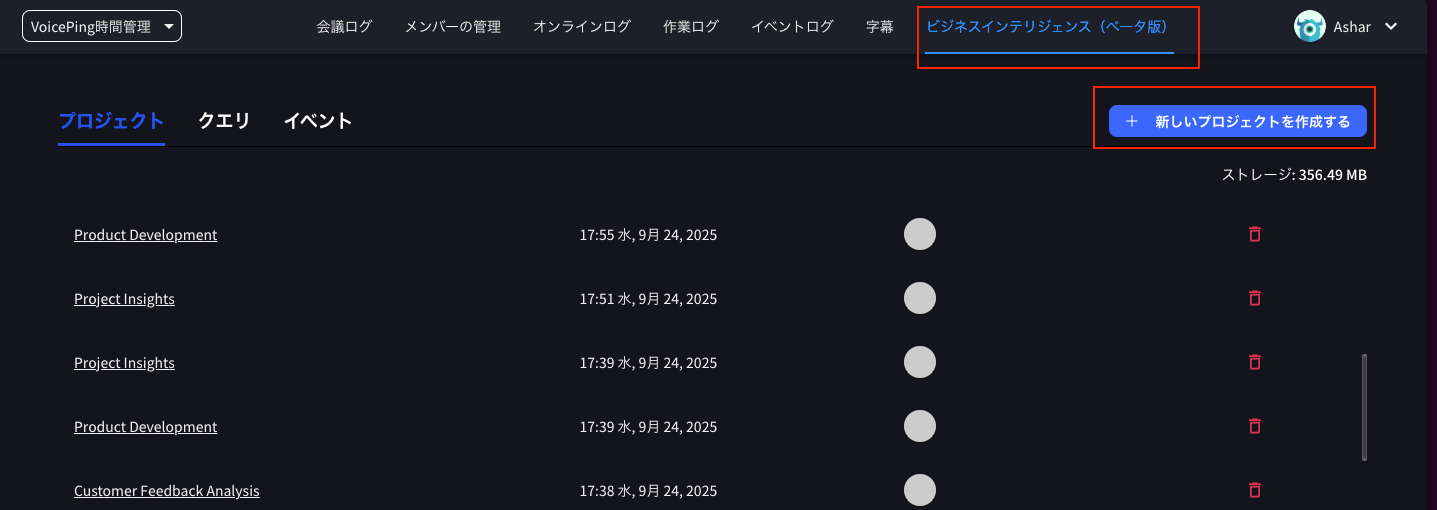
- “Create New Project” ခေါင်းစဉ်ပါ modal window ပေါ်လာပါမည်
- Project Name: မည်သည့် အမည်မဆို ထည့်သွင်းပါ (ဥပမာ “Sales Analysis”)
- Project Description: (Optional) သင်၏ analysis ၏ ဖော်ပြချက် ထည့်သွင်းပါ
- Information Source for Project: “VoicePing Meetings” ရွေးချယ်ထားကြောင်း အတည်ပြုပါ
- Create Project ကို နှိပ်ပါ

အဆင့် ၂: Project Template ရွေးချယ်ခြင်း
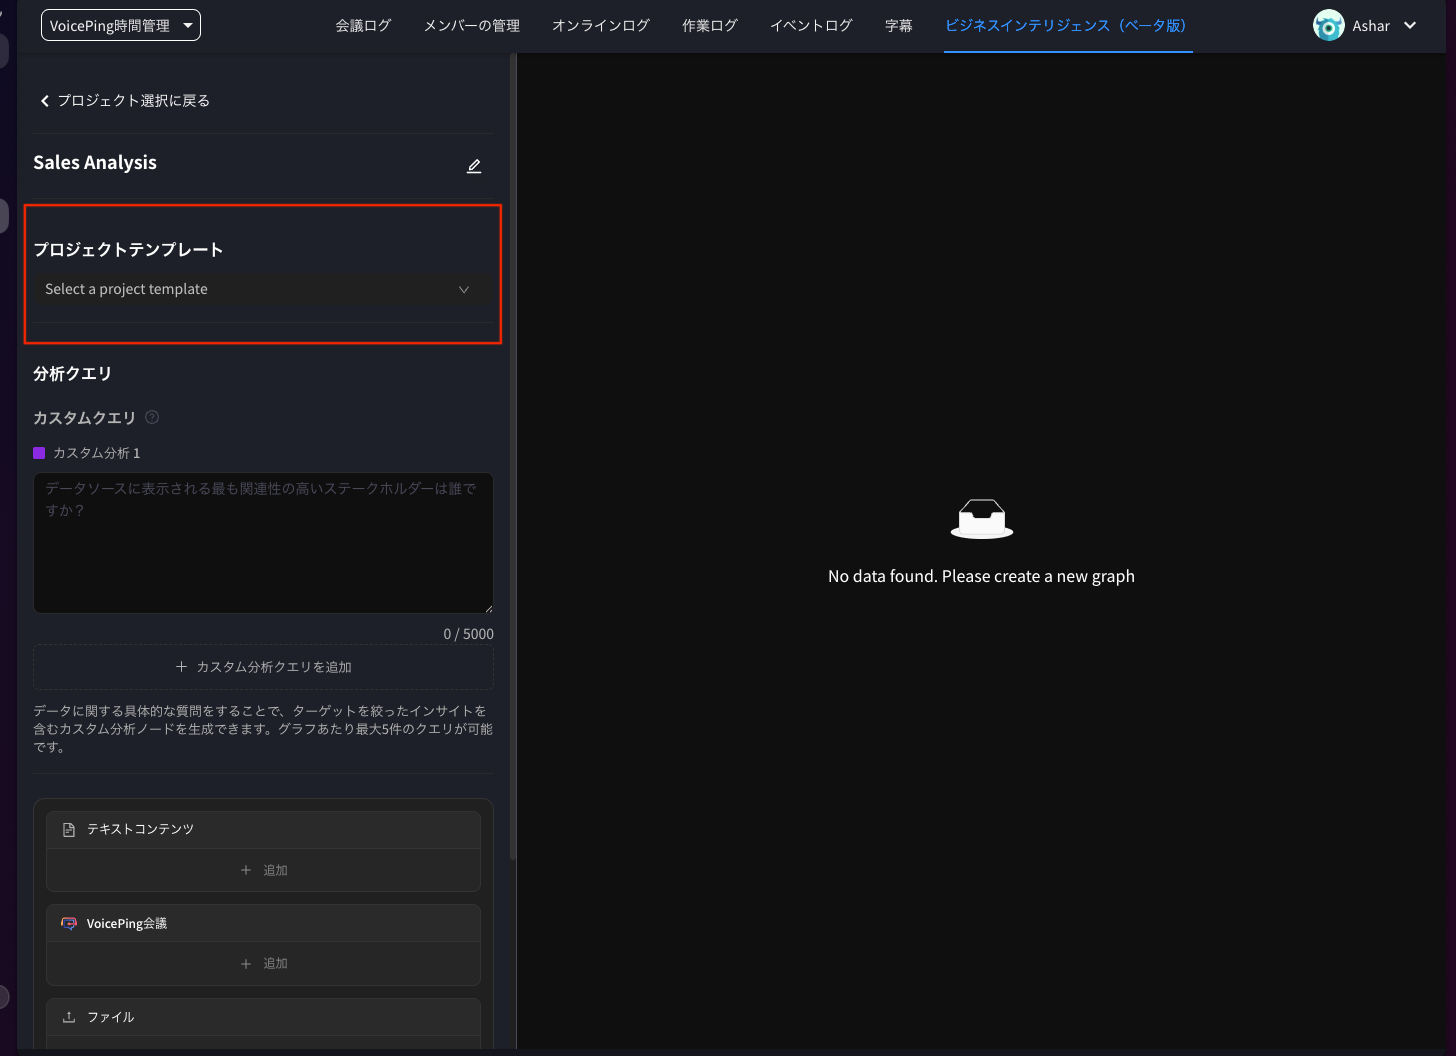
Project ဖန်တီးပြီးသောအခါ AI က သင်၏ data ကို မည်သို့ analyze လုပ်မည်ကို သတ်မှတ်သော template ရွေးချယ်ပါ။- Project screen (ဥပမာ Sales Analysis) ပြသပါမည်
- Project Template dropdown menu ကို နှိပ်ပါ
-
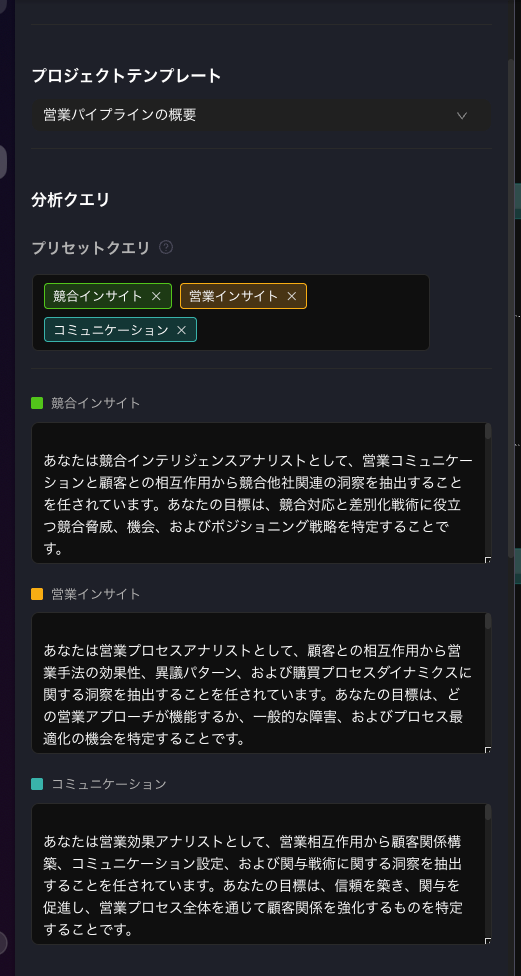
သင့် လိုအပ်ချက်နှင့် ကိုက်ညီသော template ရွေးချယ်ပါ။ ရွေးချယ်စရာများတွင် ပါဝင်သည်:
- Sales Pipeline Overview
- Product Development
- Project Insights
- Customer Feedback Analysis
-
Template (ဥပမာ Sales Pipeline Overview) ရွေးချယ်သောအခါ Preset Queries များသည် Analysis Queries section တွင် အလိုအလျောက် ပေါ်လာပါမည်
- ၎င်းတို့တွင် AI ၏ analysis ကို လမ်းညွှန်သော “Competitive Insights,” “Sales Insights,” နှင့် “Communication” ကဲ့သို့ အချက်များ ပါဝင်ပါသည်
အဆင့် ၃: Data Sources ထည့်သွင်းခြင်း
ထို့နောက် analyze လုပ်လိုသော သတ်မှတ်ထားသော meetings (transcripts) များကို ချိတ်ဆက်ပါ။- Project page ၏ အောက်ခြေရှိ VoicePing Meetings section ကို ရှာပါ
- Box ထဲရှိ + Add button ကို နှိပ်ပါ
- “Add Data Source” screen ပေါ်လာပါမည်
- Analyze လုပ်လိုသော meetings များ ဘေးရှိ boxes များကို အမှန်ခြစ်ပါ (ဥပမာ “Discussion on potential product adaptation and NDA” သို့မဟုတ် “JP customer interview…”)
- ညာဘက်အောက်ခြေရှိ အပြာရောင် Add Data Source button ကို နှိပ်ပါ

အဆင့် ၄: Graph ဖန်တီးခြင်း
Template ရွေးချယ်ပြီး data sources ထည့်သွင်းပြီးသောအခါ AI analysis ကို run ပါ။- Analysis Queries နှင့် VoicePing Meetings configure လုပ်ထားကြောင်း အတည်ပြုပါ
- Screen အောက်ခြေရှိ အပြာရောင် Create Graph button ကို နှိပ်ပါ
အဆင့် ၅: Insights ပြန်လည်သုံးသပ်ခြင်းနှင့် Export လုပ်ခြင်း
AI သည် သင်၏ data ကို process လုပ်ပြီး interactive mind map ထုတ်လုပ်ပါမည်။- Graph Interaction: Analysis results များသည် “Customer Profile” ကို ဗဟိုပြုပြီး “Purchase Timeline Evaluation” နှင့် “Objection Pattern Identification” ကဲ့သို့ nodes များသို့ branching ပြုလုပ်ပြီး ပြသပါသည်
- View Details: အသေးစိတ် analysis content ကြည့်ရန် nodes များကို နှိပ်ပါ
- Export: Data သိမ်းရန် ညာဘက်အပေါ်ရှိ buttons များ အသုံးပြုပါ
- Export as CSV: CSV format ဖြင့် raw data export လုပ်ခြင်း
- Export as Image: ပြသထားသော graph ကို image file အဖြစ် သိမ်းဆည်းခြင်း

2025-12-12 တွင် VoicePing Inc. မှ Update လုပ်ပါသည်